When reviewing clinical trial results or medical research documents, you’ll often encounter a statistical measure called the hazard ratio. Understanding HR interpretation is essential for anyone working with survival analysis data, whether you’re a researcher, healthcare professional, or medical translator handling clinical documentation across languages.
At Languages Unlimited, our medical translation and interpretation teams regularly work with clinical trial reports, research papers, and patient communications that reference hazard ratios. A misread HR can change the entire meaning of a study’s findings, which is why accurate interpretation matters at every level, from statistical analysis to cross-linguistic communication.
This guide breaks down what a hazard ratio actually tells you, how to read it correctly, and what the numbers mean in practical terms. By the end, you’ll know how to confidently interpret HR values and understand their implications for treatment outcomes and patient care decisions.
Why hazard ratios matter in trials
Clinical trials need a way to measure whether a new treatment actually extends survival or delays disease progression compared to a standard option. The hazard ratio gives you that measurement by comparing the risk of an event (like death or disease recurrence) between two groups over time. Unlike simpler statistics that only capture outcomes at a single point, HR accounts for the entire follow-up period and tells you how treatment affects risk at every moment.
You can’t assess treatment benefits properly without understanding time-to-event data. A therapy might show no difference at six months but demonstrate clear benefits at two years. Hazard ratios capture this dynamic relationship by weighing the risk continuously throughout the study period, which makes them more informative than simple survival percentages. This time-sensitive approach matters especially in oncology, cardiology, and chronic disease research where outcomes unfold gradually.
Comparing treatment effectiveness over time
When you compare two treatments in a trial, the hazard ratio shows you the relative speed at which events occur in each group. An HR of 0.70 means the treatment group experiences events at 70% the rate of the control group, translating to a 30% reduction in risk. This metric works whether you’re tracking mortality, stroke, cancer recurrence, or any other time-dependent endpoint.
The continuous nature of HR interpretation matters because it reflects real-world treatment decisions. Patients and clinicians need to know whether a drug consistently reduces risk over months or years, not just whether more people survive to a specific date. HR values integrate all the data from the study period, accounting for participants who enter late, drop out, or reach the study end without experiencing the event.
Hazard ratios provide the most accurate picture of treatment effect because they use all available time-to-event information, not just final counts.
Regulatory decisions rely on HR data
Drug approval agencies use hazard ratios as primary evidence for efficacy claims when they evaluate new treatments. The FDA and EMA specifically require HR values with confidence intervals and p-values in trial submissions because these statistics demonstrate both effect size and statistical certainty. A significant HR can determine whether a drug reaches patients or remains in development.
Your clinical documentation must present HR data accurately because regulatory reviewers scrutinize these numbers closely. They look for appropriate statistical methods, adequate sample sizes, and proper adjustment for confounding factors. Medical translators working with trial protocols and reports need solid understanding of HR interpretation to maintain accuracy across languages, ensuring international regulatory submissions preserve the precise statistical meaning of the original findings.
How to interpret hazard ratios step by step
Reading a hazard ratio correctly means following a systematic approach that prevents misinterpretation of trial results. You need to examine several statistical components together rather than relying on the HR number alone. This step-by-step process ensures you understand both the magnitude of the treatment effect and how confident you can be in the findings.
Reading the HR number itself
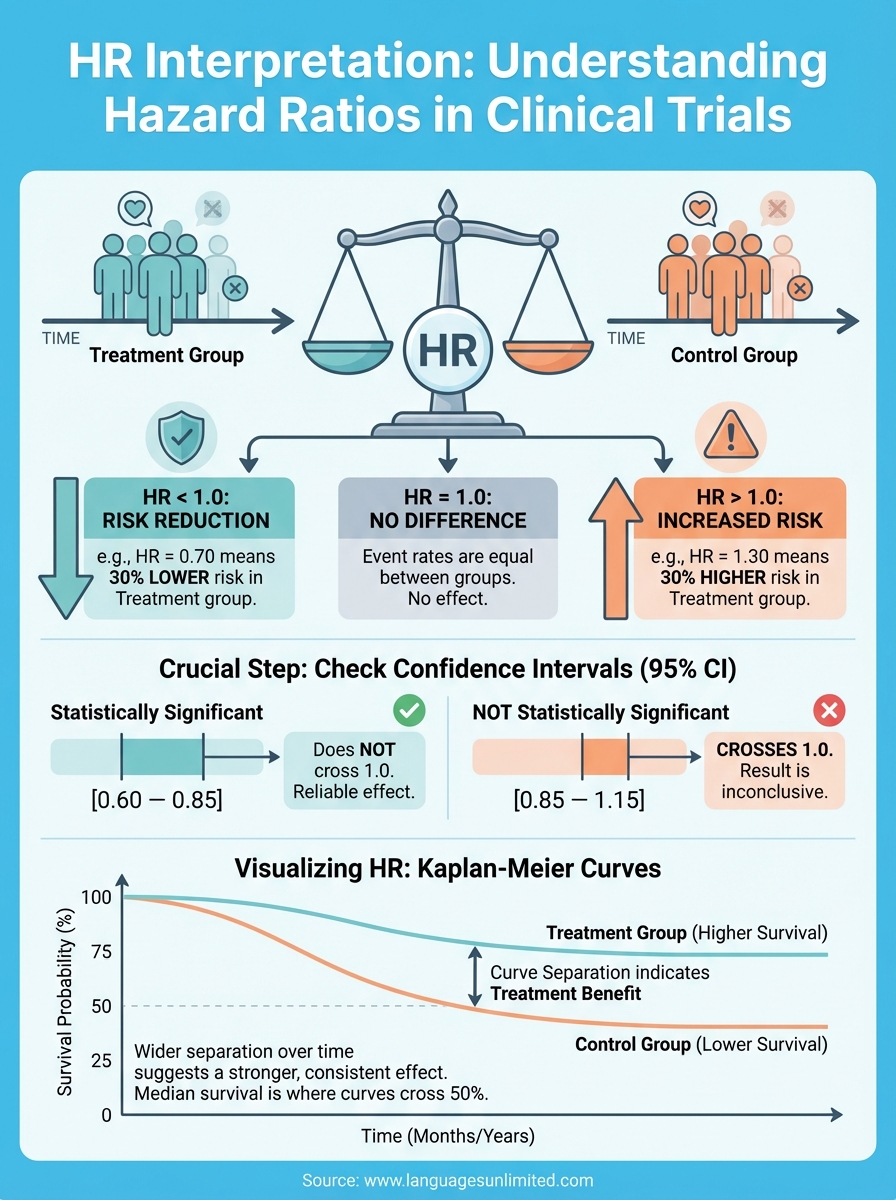
Start by looking at the hazard ratio value and determining which side of 1.0 it falls on. An HR below 1.0 indicates the treatment reduces risk (HR = 0.75 means 25% risk reduction), while values above 1.0 show increased risk (HR = 1.30 means 30% risk increase). An HR of exactly 1.0 means no difference between groups. You calculate the percentage reduction by subtracting the HR from 1.0 and multiplying by 100, so an HR of 0.60 represents a 40% reduction in the rate of events.
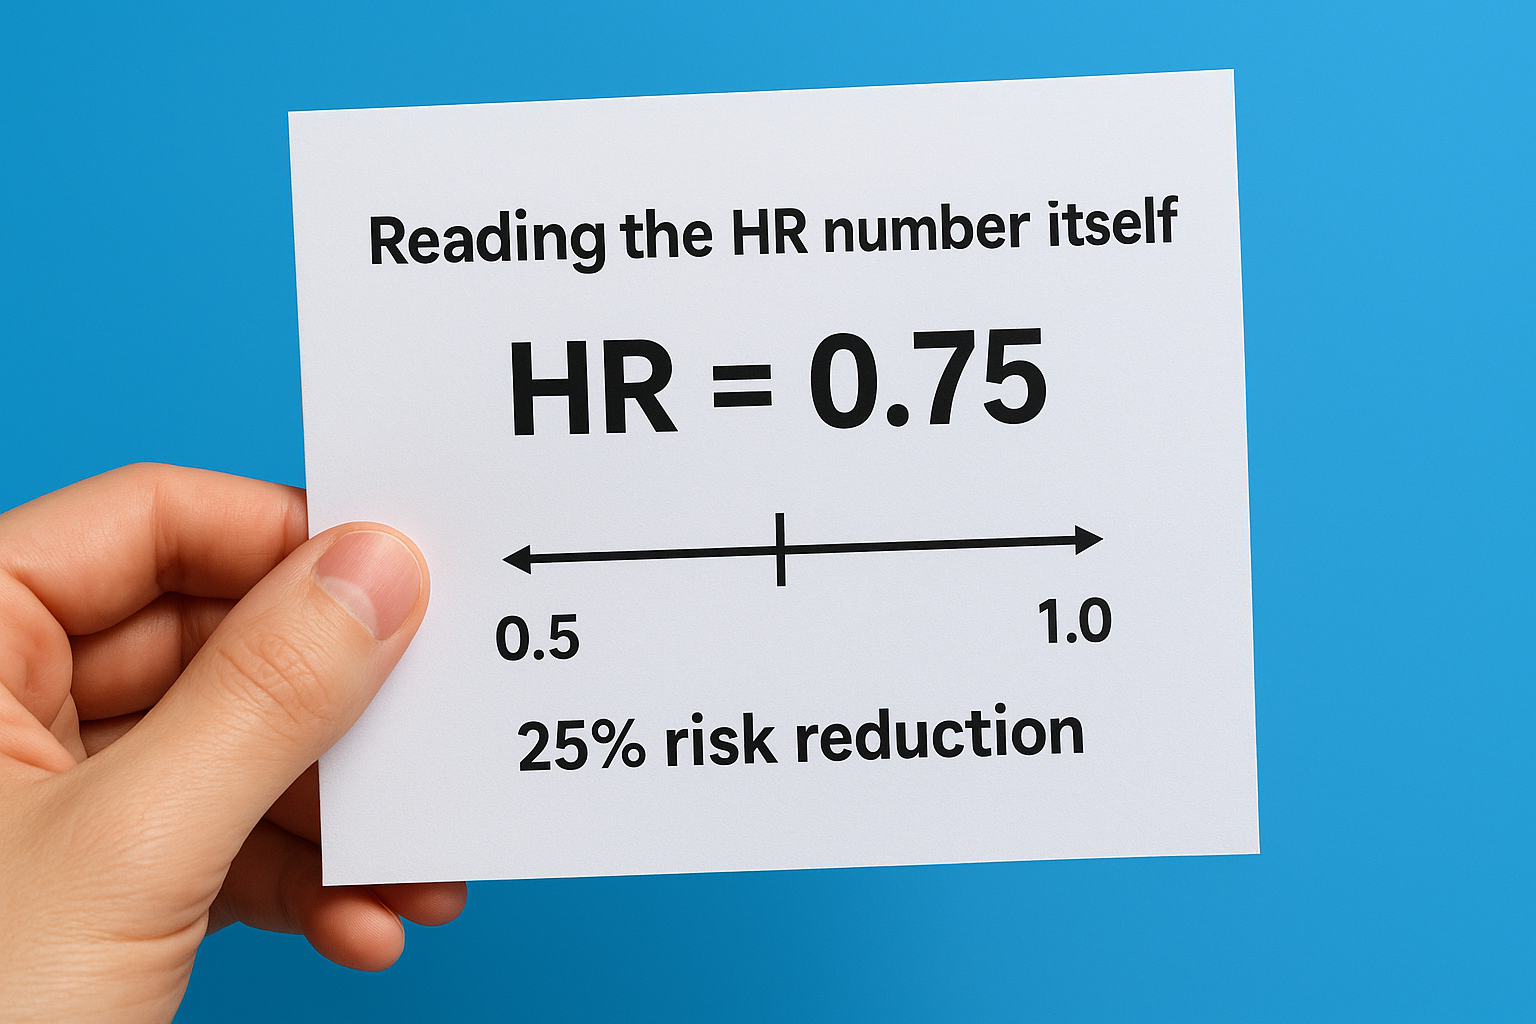
The further the hazard ratio sits from 1.0, the stronger the treatment effect, whether beneficial or harmful.
Checking confidence intervals
Never interpret HR values without examining the 95% confidence interval, which tells you the range where the true HR likely falls. If the confidence interval crosses 1.0 (for example, 0.85 to 1.15), the result lacks statistical significance regardless of the point estimate. Narrow confidence intervals indicate precise estimates with adequate sample sizes, while wide intervals suggest uncertainty. Your hr interpretation must account for this statistical reliability before drawing conclusions about treatment effectiveness. Always report both the HR and its confidence interval to provide complete context for decision-making.
How hazard ratio differs from risk and odds
Medical research uses several statistical measures to compare treatment groups, and each tells you something different about the data. You’ll encounter risk ratios, odds ratios, and hazard ratios in clinical literature, but these metrics answer distinct questions and apply to different study designs. Understanding these differences prevents you from mixing up statistical findings or drawing incorrect conclusions from trial results.
Risk ratios measure cumulative probability
Risk ratio (also called relative risk) compares the probability of an event occurring in two groups at a specific point in time. You calculate it by dividing the proportion of events in the treatment group by the proportion in the control group at the study endpoint. A risk ratio of 0.80 means the treatment group has 80% of the control group’s probability of experiencing the event by that fixed time point. This metric works well for studies with complete follow-up and clear endpoints, but it ignores when events happen during the observation period.
Odds ratios compare likelihood of events
Odds ratio measures the odds of an event occurring versus not occurring, comparing these odds between two groups. You see OR values frequently in case-control studies and logistic regression analyses where researchers look backward at exposures. An odds ratio approximates risk ratio when events are rare, but the two diverge as events become common. Medical researchers often use OR because of its mathematical properties in certain analyses, though it’s harder to interpret intuitively than risk ratios.
Hazard ratios account for timing throughout the study, while risk and odds ratios only measure outcomes at the endpoint.
Time-dependent nature sets HR apart
Proper hr interpretation recognizes that hazard ratios differ fundamentally by incorporating time continuously rather than measuring probability at one moment. HR compares instantaneous event rates at every point during follow-up, accounting for participants who enter late, drop out, or remain event-free at study end. This time-sensitive approach makes HR the preferred metric for survival analysis when you need to understand how treatment affects risk throughout the entire observation period.
How to read HR with Kaplan-Meier curves
Kaplan-Meier curves translate hazard ratios into visual representations that show you how survival probability changes over time for each treatment group. These curves plot the percentage of participants remaining event-free on the vertical axis against time on the horizontal axis, creating a stepped line that drops whenever events occur. When you pair KM curves with HR values, you get both the numerical measure of treatment effect and a visual picture of how that effect unfolds across the study period.
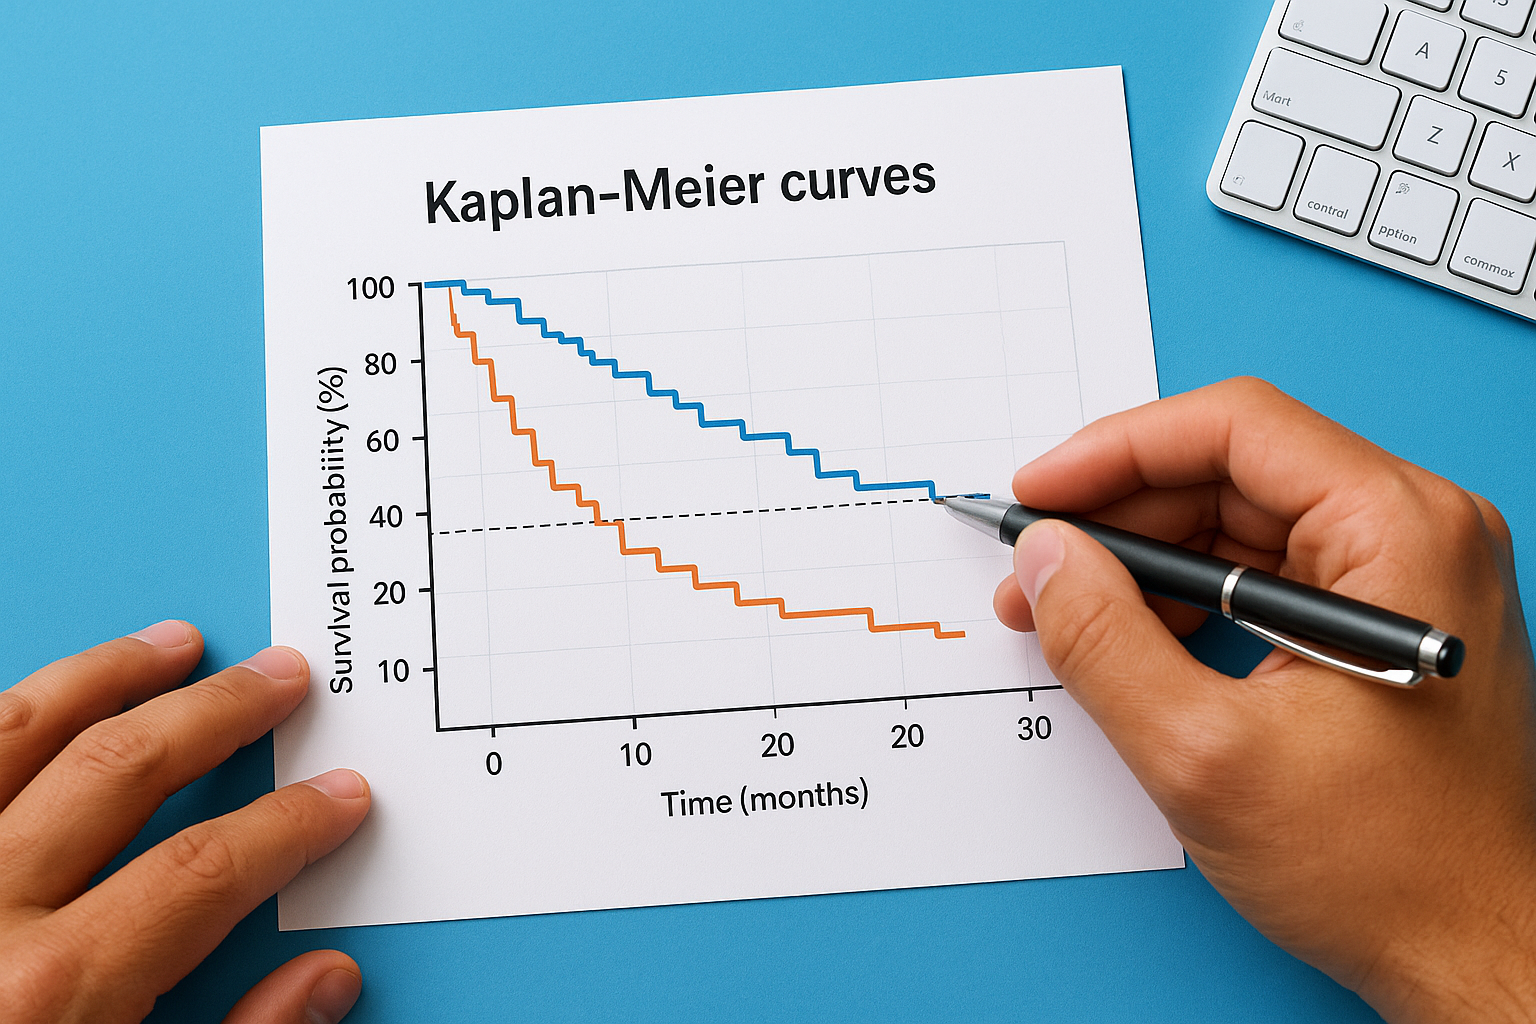
Reading curve separation
The vertical distance between two curves shows you the difference in survival probability at any given time point. Wider separation indicates larger treatment differences, while curves that overlap suggest minimal effect. You’ll notice the curves typically start at 100% (everyone event-free) and descend as participants experience events, with the better treatment maintaining a higher position throughout follow-up. Your hr interpretation becomes more intuitive when you see curves that separate early and maintain that gap, indicating consistent treatment benefit from the start.
The degree and timing of curve separation tell you whether treatment benefits appear immediately or emerge gradually over time.
Connecting curves to HR values
Look for the median survival time marked where each curve crosses the 50% line, as this shows you the point where half the participants experienced the event. The hazard ratio quantifies the consistent difference in event rates that produces the curve separation you observe. A significant HR with widely separated curves gives you strong visual and statistical evidence of treatment effect, while narrow confidence intervals around the HR correspond to curves that maintain consistent separation without overlapping at later time points.
Common pitfalls and reporting tips
You can avoid the most frequent mistakes in hr interpretation by recognizing where researchers and readers typically go wrong with hazard ratio data. Even experienced professionals sometimes misinterpret statistical significance, overlook important assumptions, or present HR values without crucial context. Understanding these common errors helps you evaluate trial results more critically and communicate findings accurately in clinical documentation, research papers, or patient materials.
Misreading confidence intervals
Many readers focus solely on whether the p-value falls below 0.05 and ignore the confidence interval width, which tells you about precision and clinical relevance. You might see an HR of 0.82 with a confidence interval of 0.68 to 0.99, which is statistically significant but includes values approaching no effect. Conversely, an HR of 0.75 with a wide interval from 0.50 to 1.12 crosses 1.0 and lacks statistical significance despite an apparently beneficial point estimate. Always report both the HR and its confidence interval rather than relying on p-values alone to tell the complete story about treatment effectiveness.
Confidence intervals reveal both the precision of your estimate and the range of plausible treatment effects.
Reporting hazard ratios accurately
Your documentation should specify which group serves as the reference (usually the control or standard treatment) so readers know whether HR values below 1.0 indicate benefit or harm. Include the time period analyzed, the number of events in each group, and any adjustments made for confounding variables through Cox regression models. Medical translators working with multilingual trial reports must preserve these statistical details precisely, as even small changes in wording can alter the meaning of HR findings across languages.
Final takeaways
Accurate hr interpretation requires you to examine the hazard ratio value, confidence intervals, and visual data together rather than relying on any single metric. You now understand that HR values below 1.0 indicate risk reduction, values above 1.0 show increased risk, and the distance from 1.0 reveals the magnitude of treatment effect. Always check whether confidence intervals cross 1.0 before drawing conclusions about statistical significance.
Remember that hazard ratios capture time-dependent risk throughout a study period, which makes them fundamentally different from risk ratios or odds ratios that measure outcomes at fixed points. Kaplan-Meier curves give you the visual context you need to see how treatment effects unfold over time and whether benefits appear immediately or emerge gradually.
When you work with clinical trial documentation, statistical reports, or medical communications that cross language barriers, precision matters at every level. Our team at Languages Unlimited helps healthcare organizations and research institutions translate complex medical content accurately. Contact us to discuss your clinical documentation needs.